.jpeg)
TL;DR
- Traditional brand protection metrics count takedowns and platform coverage, which measure effort, not whether counterfeits still dominate what shoppers see.
- Saturation Rate measures the percentage of first-page marketplace search results that are infringing, putting the consumer's experience at the center of the measurement.
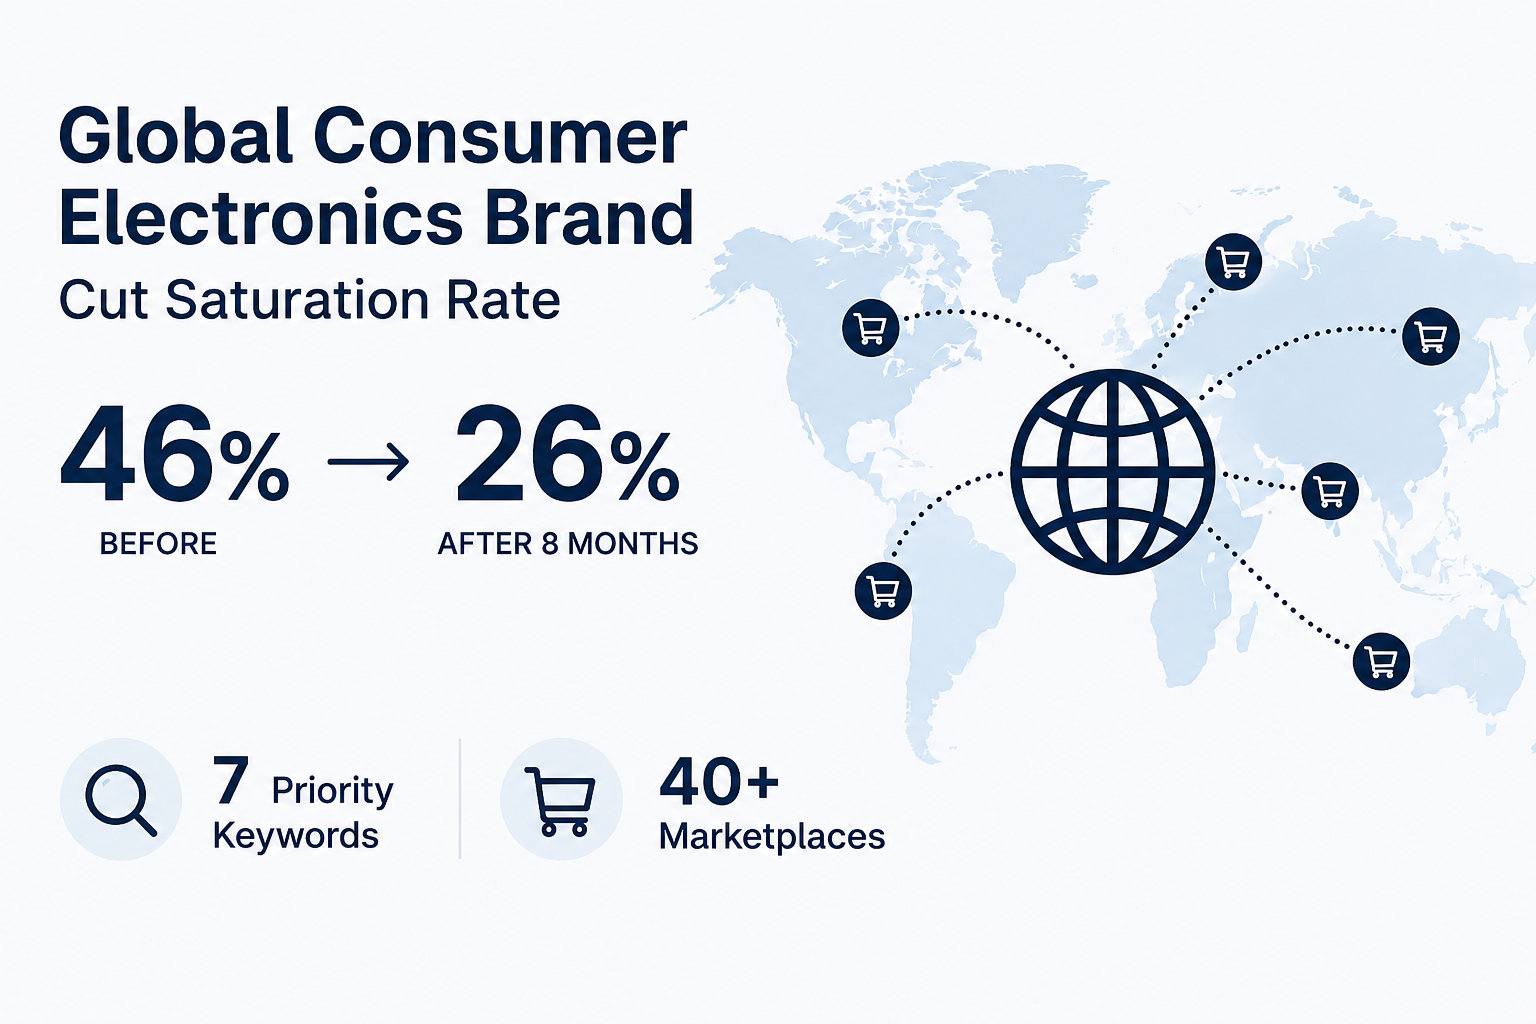
- A global consumer electronics brand cut its saturation rate from 46% to 26% in 8 months, a 20 percentage-point drop, across 7 priority keywords and 40+ marketplaces.
- The decline followed a predictable curve: a steep early drop, a slower middle phase, then stabilization that reveals the structural floor of online-only enforcement and points to where revenue recovery efforts should focus next.
- Outcome data turned reporting into a planning tool, letting the team decide when to keep enforcing, rotate keywords, or escalate to offline action.
The Problem with Counting Takedowns
Brand protection programs have long measured success the same way: how many listings were detected, how many were taken down, how many platforms were covered. These numbers look impressive in quarterly reports. They are also nearly meaningless.
A brand can remove 50,000 infringing listings in a single month and still have counterfeits dominating the first page of search results on every major marketplace. The scale of the problem is enormous: drawing on 2021 customs data, the OECD valued global trade in counterfeit goods at roughly $467 billion, or 2.3% of total global imports, per the OECD's 2025 fakes report. That is because traditional enforcement metrics measure effort, not outcomes. They answer the question "how much did we do?" but not the question that actually matters: when a consumer searches for our product, what do they see?
This distinction, between effort and outcome, is the gap that a metric called the Saturation Rate was designed to close. Saturation Rate measures the percentage of results on the first page of consumer-facing marketplace searches that are infringing. It treats the consumer's experience as the unit of measurement, not the enforcement team's activity log.
The difference is not semantic.
A program optimized for takedown volume hunts listings at any depth across any keyword variation and maximizes removals. A program optimized for saturation rate monitors the specific searches real buyers use, classifies every result on the page (counterfeit, suspected, authorized, irrelevant), and tracks whether the shelf is getting cleaner over time.
One counts swings. The other checks the scoreboard.
The Industry Shift: Activity Metrics vs. Outcome Metrics
The Brand's Starting Point
A leading global consumer electronics company was already running what most would consider a mature brand protection program. They had a dedicated team, a long-standing enforcement vendor, and active monitoring across more than 40 global marketplaces. Takedown volumes were consistently high. Marketplace coverage was broad. (If you're just getting started, see our brand protection starter guide.)
But inside the organization, the brand protection team faced a recurring problem: they could not answer the most basic question their business stakeholders kept asking. Is it working?
Their existing vendor delivered regular activity summaries: listings found, listings removed, platforms monitored. The numbers went up every quarter, which should have been reassuring. Instead, it raised a harder question: if we keep removing more listings every period, does that mean the problem is growing, or that we are making progress? There was no way to tell. The metrics could not distinguish between a program that was winning and one that was running in place.
The team needed a way to show the business what they were doing and, more importantly, what was changing as a result.
Why They Switched Approaches
Nine months before their vendor contract came up for renewal, the brand began proactively weighing alternatives. They were not reacting to a crisis. They were looking for the most advanced tools and methodologies available, and they were willing to test multiple providers to find them.
Three vendors competed in staggered one-week trials. The brand deliberately withheld its evaluation criteria to see how each provider would perform without a playbook to follow.
What separated the winning provider was not raw detection volume. It was two things that enterprise buyers rarely get to experience during a vendor trial: product responsiveness and strategic reframing.
On responsiveness: the provider's product manager joined customer calls directly and personally scoped feature requests raised during the trial. Two capabilities the brand asked for, a watch list for tracking domains after enforcement action and a translation toggle for reviewing foreign-language listings, were built and deployed within weeks. Not promised on a roadmap. Shipped.
On strategic framing: instead of competing on who could find the most listings, the provider reframed the entire engagement around saturation rate. This gave the brand protection team something they had never had, a metric they could take to internal stakeholders that communicated program impact in business terms, not enforcement jargon.
That changed the internal conversation from "here's what we spent on brand protection" to "here's what brand protection achieved."
The Results
Implementation began in August 2025 with a focused scope: 7 priority keywords monitored across 40+ global marketplaces through 96 recurring searches.
At the outset, the brand's saturation rate, the share of first-page search results that were infringing, stood at 46%.
Nearly half of what consumers saw when searching for this brand's products was counterfeit. That exposure has real consequences for buyers: research found that consumers deceived into buying counterfeits online did so at least once in the past year.
Eight months later, that number was 26%.
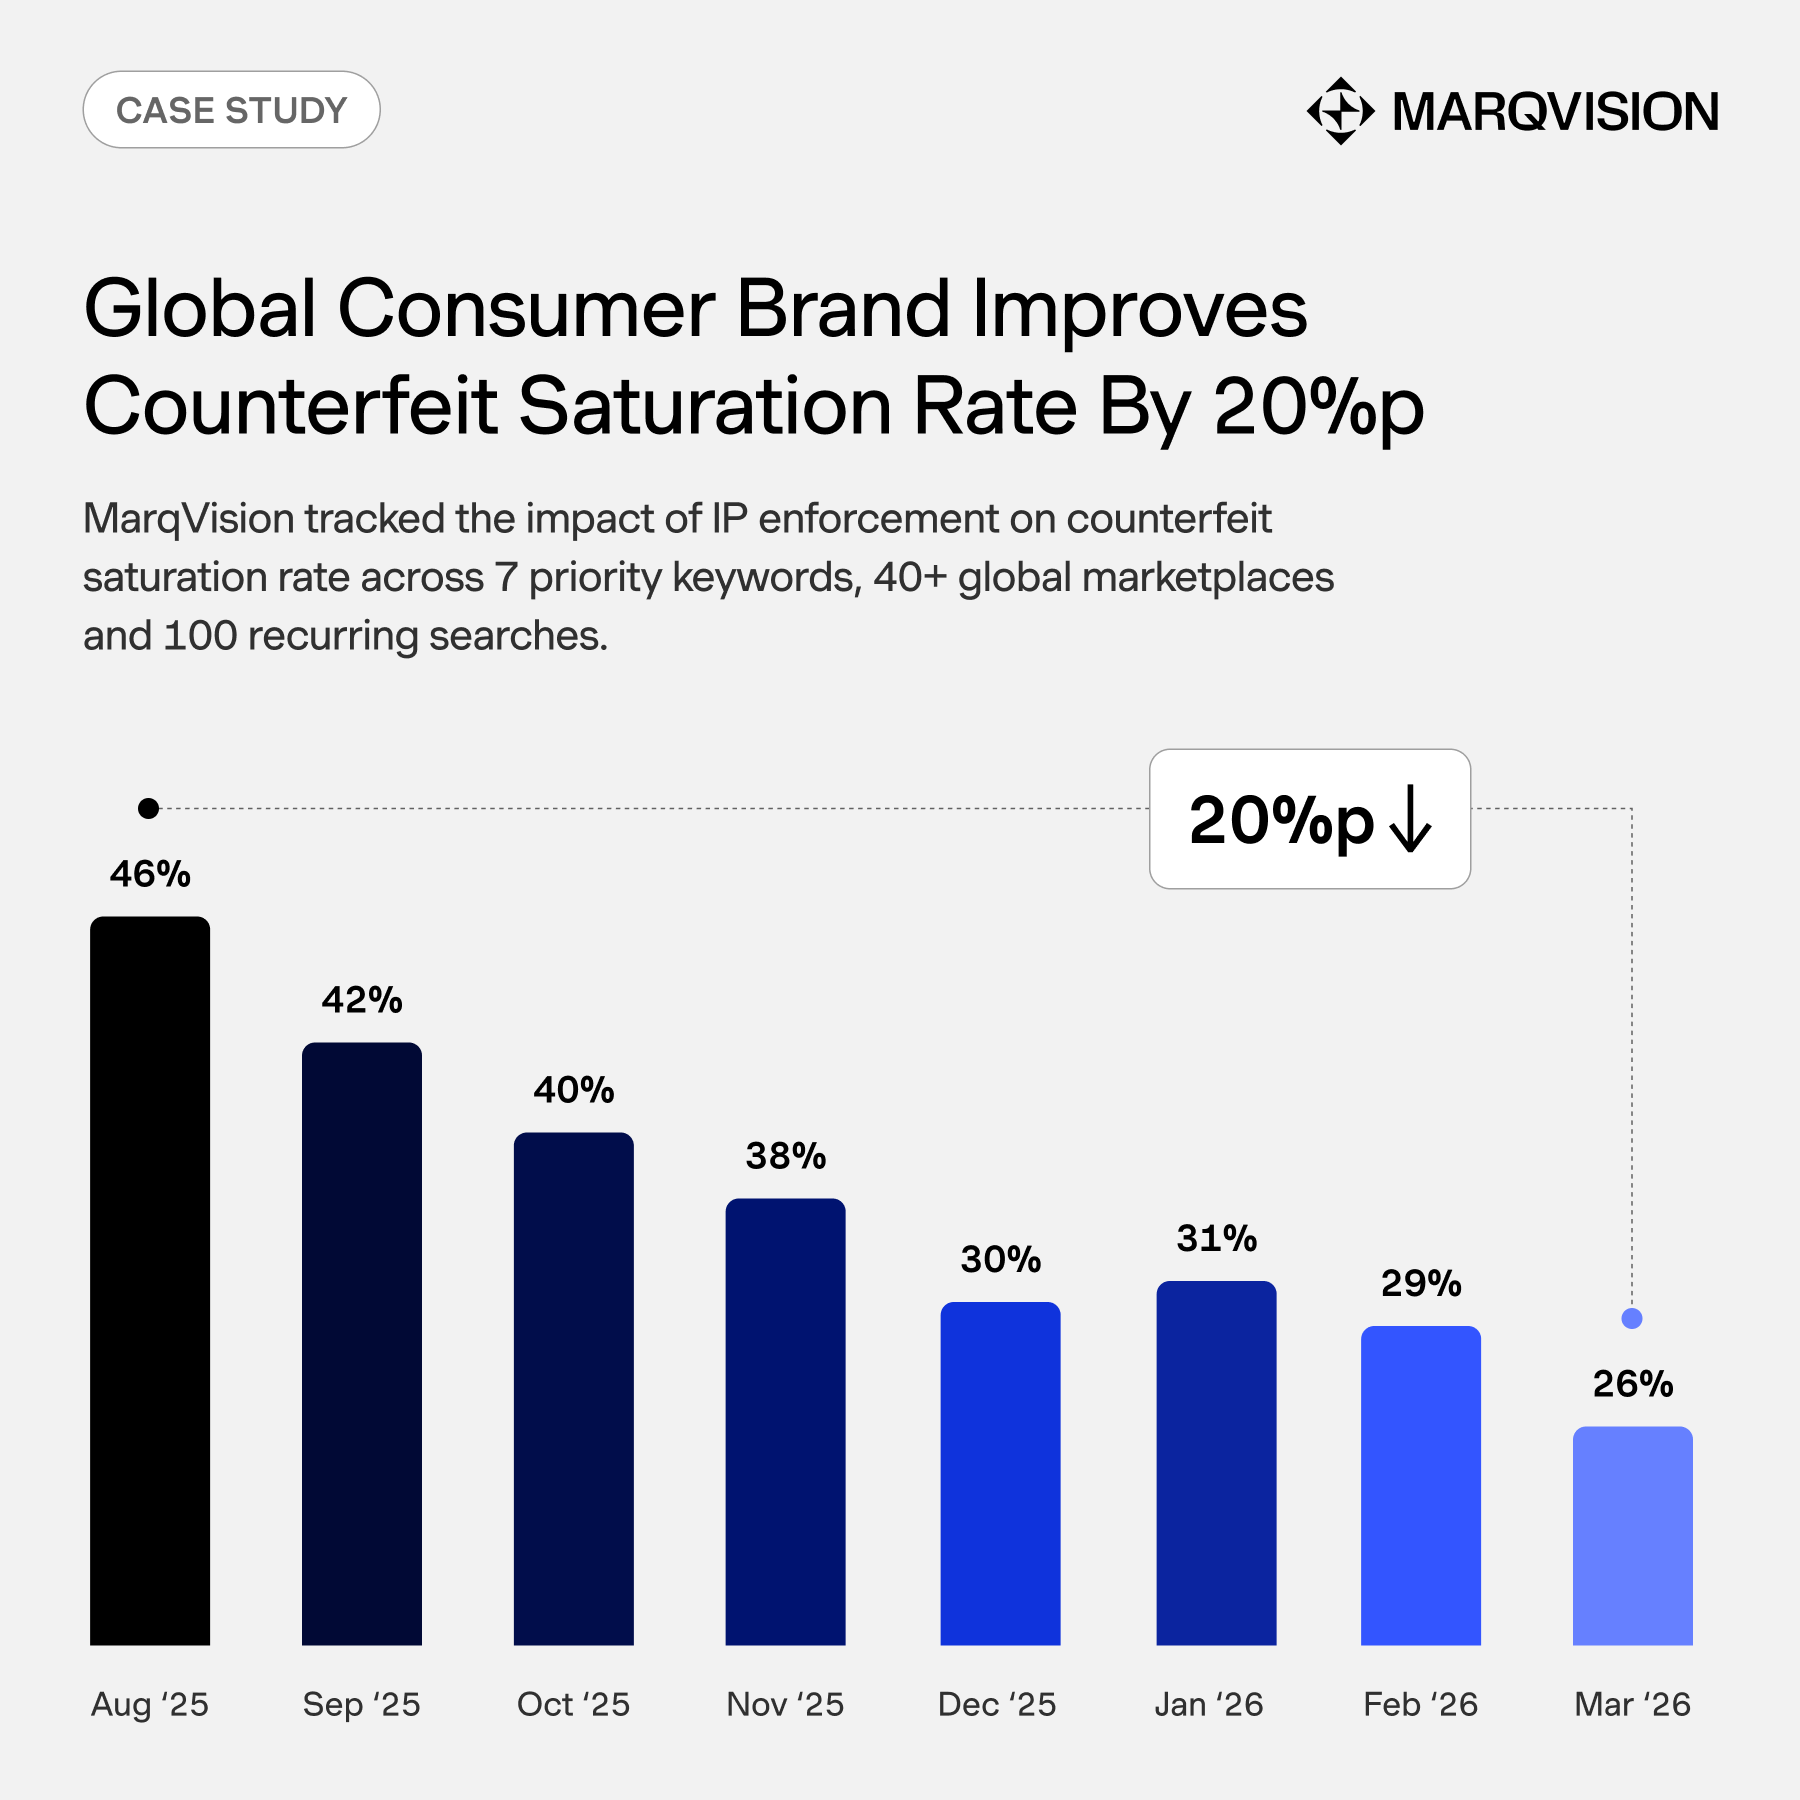
Saturation Rate Trend: Month-by-Month Decline
Key Metrics at a Glance
- Starting saturation rate: 46%
- Saturation rate at 8 months: 26%
- Total improvement: 20 percentage points
- Priority keywords tracked: 7
- Global marketplaces covered: 40+
- Recurring searches monitored: 96
- Manual follow-up time reduced: 2+ hours per week
Reading the Curve
The shape of the decline tells its own story, and it maps to a pattern we see consistently across enterprise brand protection programs:
Months 1 ~ 3: Steep decline (46% → 38%)
This is the low-hanging fruit phase, where clearly enforceable infringement is identified and removed quickly. The listings are obvious, the platforms have set takedown procedures, and compliance rates are high.
Months 4 ~ 6: Slower decline (38% → 31%)
The rate of improvement slows as remaining infringement becomes harder to tackle: listings on platforms with slower response times, sellers who relist rapidly after removal, and edge cases where infringement classification is ambiguous.
Months 7 ~ 8: Stabilization (31% → 26%)
This stabilization is not a failure. It is a signal. It reveals the structural floor for a given set of keywords and platforms, the point at which online enforcement alone cannot push the number lower. This is where the data starts informing the next strategic move.
What Happens When the Curve Stabilizes
The stabilization phase is where saturation rate data becomes a planning tool. Depending on what the data shows, brand protection teams face one of three scenarios:
A takedown volume report cannot surface these strategic inflection points. A saturation rate trend line makes them visible by default.
What This Changes for Brand Protection Teams
The immediate day-to-day impact was measurable: the brand's team reduced manual follow-up by more than two hours per week, down from an estimated five to ten vendor-related emails per week to near-zero. Takedown volumes remained on par with the previous program, but the team no longer needed to chase status updates because outcomes were visible in the data.
The deeper impact was structural. Saturation rate data gave the brand protection team a planning tool, not merely a reporting tool. When the rate for a given keyword plateaus, the team can make an informed decision: keep enforcing to hold the line, rotate to a new keyword cluster where the rate is higher, or escalate to offline enforcement where online action has reached its limit.
This changed the vendor relationship from service provider to strategic partner. The brand allocated dedicated analyst hours for proactive research and trend surfacing — work that the previous program structure did not support because there was no data framework to guide it.
For any brand protection team that has spent years reporting activity metrics and struggling to articulate program impact to the business, the shift to outcome measurement is not incremental. It is the difference between describing what you did and proving what changed.
Enforcement volume will always be part of brand protection. But without an outcome metric tied to the consumer experience, there is no way to know whether a program is winning, or just busy.
Frequently Asked Questions
What is saturation rate in brand protection?
Saturation rate is the percentage of results on the first page of a consumer-facing marketplace search that are infringing. Instead of counting how many listings a team removed, it measures what a buyer actually sees when they search for a product, making the consumer's experience the unit of measurement.
How is saturation rate different from takedown volume?
Takedown volume answers "how many infringements did we remove?" and measures effort. Saturation rate answers "of everything a buyer sees when they search, what percentage is infringing?" and measures results. A brand can remove tens of thousands of listings and still have counterfeits dominating the first page, which is why outcome data tells a clearer story than activity counts.
How much did the consumer electronics brand reduce its saturation rate?
The brand cut its saturation rate from 46% to 26% in eight months, a 20 percentage-point drop. The program tracked 7 priority keywords across more than 40 marketplaces through 96 recurring searches.
Why does the saturation rate curve stabilize over time?
The decline follows a predictable pattern: a steep early drop as obvious, clearly enforceable infringement is removed quickly, then a slower middle phase as the harder cases remain. These harder cases include listings on platforms with slow response times, sellers who relist rapidly after removal, and edge cases where infringement classification is ambiguous. Eventually the rate stabilizes. That plateau reveals the structural floor for a given set of keywords and platforms, the point where online enforcement alone cannot push the number lower and offline action becomes the next move.
What should a team do when saturation rate plateaus?
A plateau is a planning signal, not a failure. Depending on what the data shows, teams can keep enforcing to hold the line, rotate to a new keyword cluster where the rate is higher, or escalate to offline action such as test buys, seller network analysis, and legal filings.
Stay up to date on the latest IP Protection content from MarqVision.


4 Enforcements a Week to 400: Scale Brand Safety with Marq AI

Don’t Just Find Counterfeits. Dismantle the Entire Network.

.png)
Discover the latest trends and challenges in IP protection

Take Control of Your Trademarks with MARQ Folio
Renew and Manage Your Trademarks Easily With MARQ Folio

We’re waiting to hear from you

See the best brand protection solution in action

Don’t let piracy steal your growth

Talk to us about your brand protection problems